Learn about smart growth
Get involved


News
Transportation for America releases Dangerous by Design 2011
By 3lane, May 24, 2011
 In the last decade, from 2000 through 2009, more than 47,700 pedestrians were killed in the United States - the equivalent of a jumbo jet full of passengers crashing roughly every month. On top of that, more than 688,000 pedestrians were injured during that time as well - a number equivalent to a pedestrian being struck by a car or truck every 7 minutes.
Despite the magnitude of these avoidable tragedies, little public attention and even less in public resources have been committed to reducing pedestrian deaths and injuries in the United States. On the contrary, transportation agencies typically prioritize speeding traffic over the safety of people on foot or other vulnerable road users.
Transportation for America's Dangerous by Design 2011 examines this problem and America's streets that are "dangerous by design" — engineered for speeding traffic with little or no provision for people on foot, in wheelchairs or on bicycles.
This year's edition of the report is accompanied by an interactive map that tracks pedestrian fatalities from 2001 to 2009 across the country. Type an address and click on any point to see the available information about the victim, the date, the location, the street type and even what the road looks like via Google Street View.
In the last decade, from 2000 through 2009, more than 47,700 pedestrians were killed in the United States - the equivalent of a jumbo jet full of passengers crashing roughly every month. On top of that, more than 688,000 pedestrians were injured during that time as well - a number equivalent to a pedestrian being struck by a car or truck every 7 minutes.
Despite the magnitude of these avoidable tragedies, little public attention and even less in public resources have been committed to reducing pedestrian deaths and injuries in the United States. On the contrary, transportation agencies typically prioritize speeding traffic over the safety of people on foot or other vulnerable road users.
Transportation for America's Dangerous by Design 2011 examines this problem and America's streets that are "dangerous by design" — engineered for speeding traffic with little or no provision for people on foot, in wheelchairs or on bicycles.
This year's edition of the report is accompanied by an interactive map that tracks pedestrian fatalities from 2001 to 2009 across the country. Type an address and click on any point to see the available information about the victim, the date, the location, the street type and even what the road looks like via Google Street View.
 The selection above highlights a fatality in Orlando, which ranked as the #1 most dangerous metro area in the country for pedestrian deaths. Information about every state and their pedestrian fatalities accompany the report.
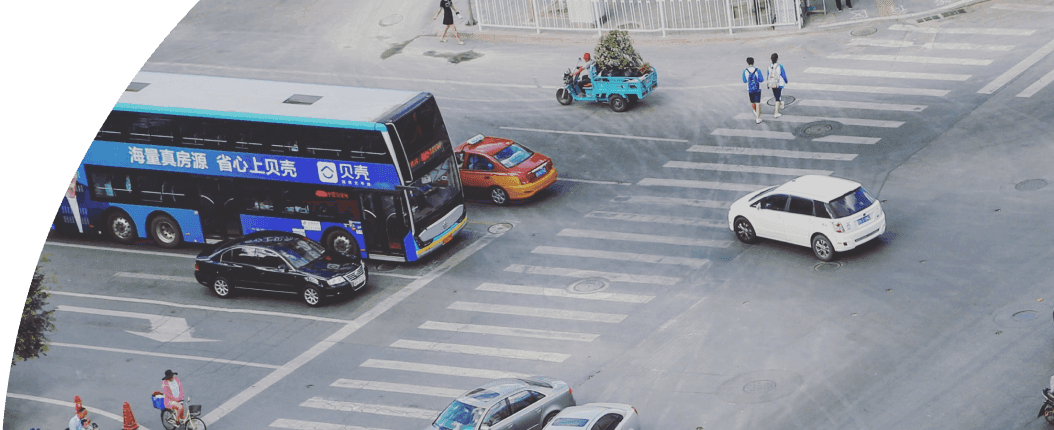
As the map reveals, many of these fatalities occur along roads that aren't built to accommodate pedestrians, but changing these conditions is relatively easy and affordable. Taxpayer money distributed to the states for transportation should be used to build streets, roads and highways that are safe for all users. With millions of Americans walking along and crossing these federally funded roads each day, the billions in federal dollars spent on them each year must result in safer conditions for pedestrians.
Read the full report, view state-by-state analysis and explore a map of pedestrian fatalities over the last decade at Transportation for America.
The selection above highlights a fatality in Orlando, which ranked as the #1 most dangerous metro area in the country for pedestrian deaths. Information about every state and their pedestrian fatalities accompany the report.
As the map reveals, many of these fatalities occur along roads that aren't built to accommodate pedestrians, but changing these conditions is relatively easy and affordable. Taxpayer money distributed to the states for transportation should be used to build streets, roads and highways that are safe for all users. With millions of Americans walking along and crossing these federally funded roads each day, the billions in federal dollars spent on them each year must result in safer conditions for pedestrians.
Read the full report, view state-by-state analysis and explore a map of pedestrian fatalities over the last decade at Transportation for America.

1350 I St NW Suite 425 Washington, DC 20005
[email protected]Livable places. Healthy people. Shared prosperity.


© 2025 Smart Growth America. All rights reserved
Site By3Lane Marketing
