


News
By Miguel Rodríguez, October 31, 2025
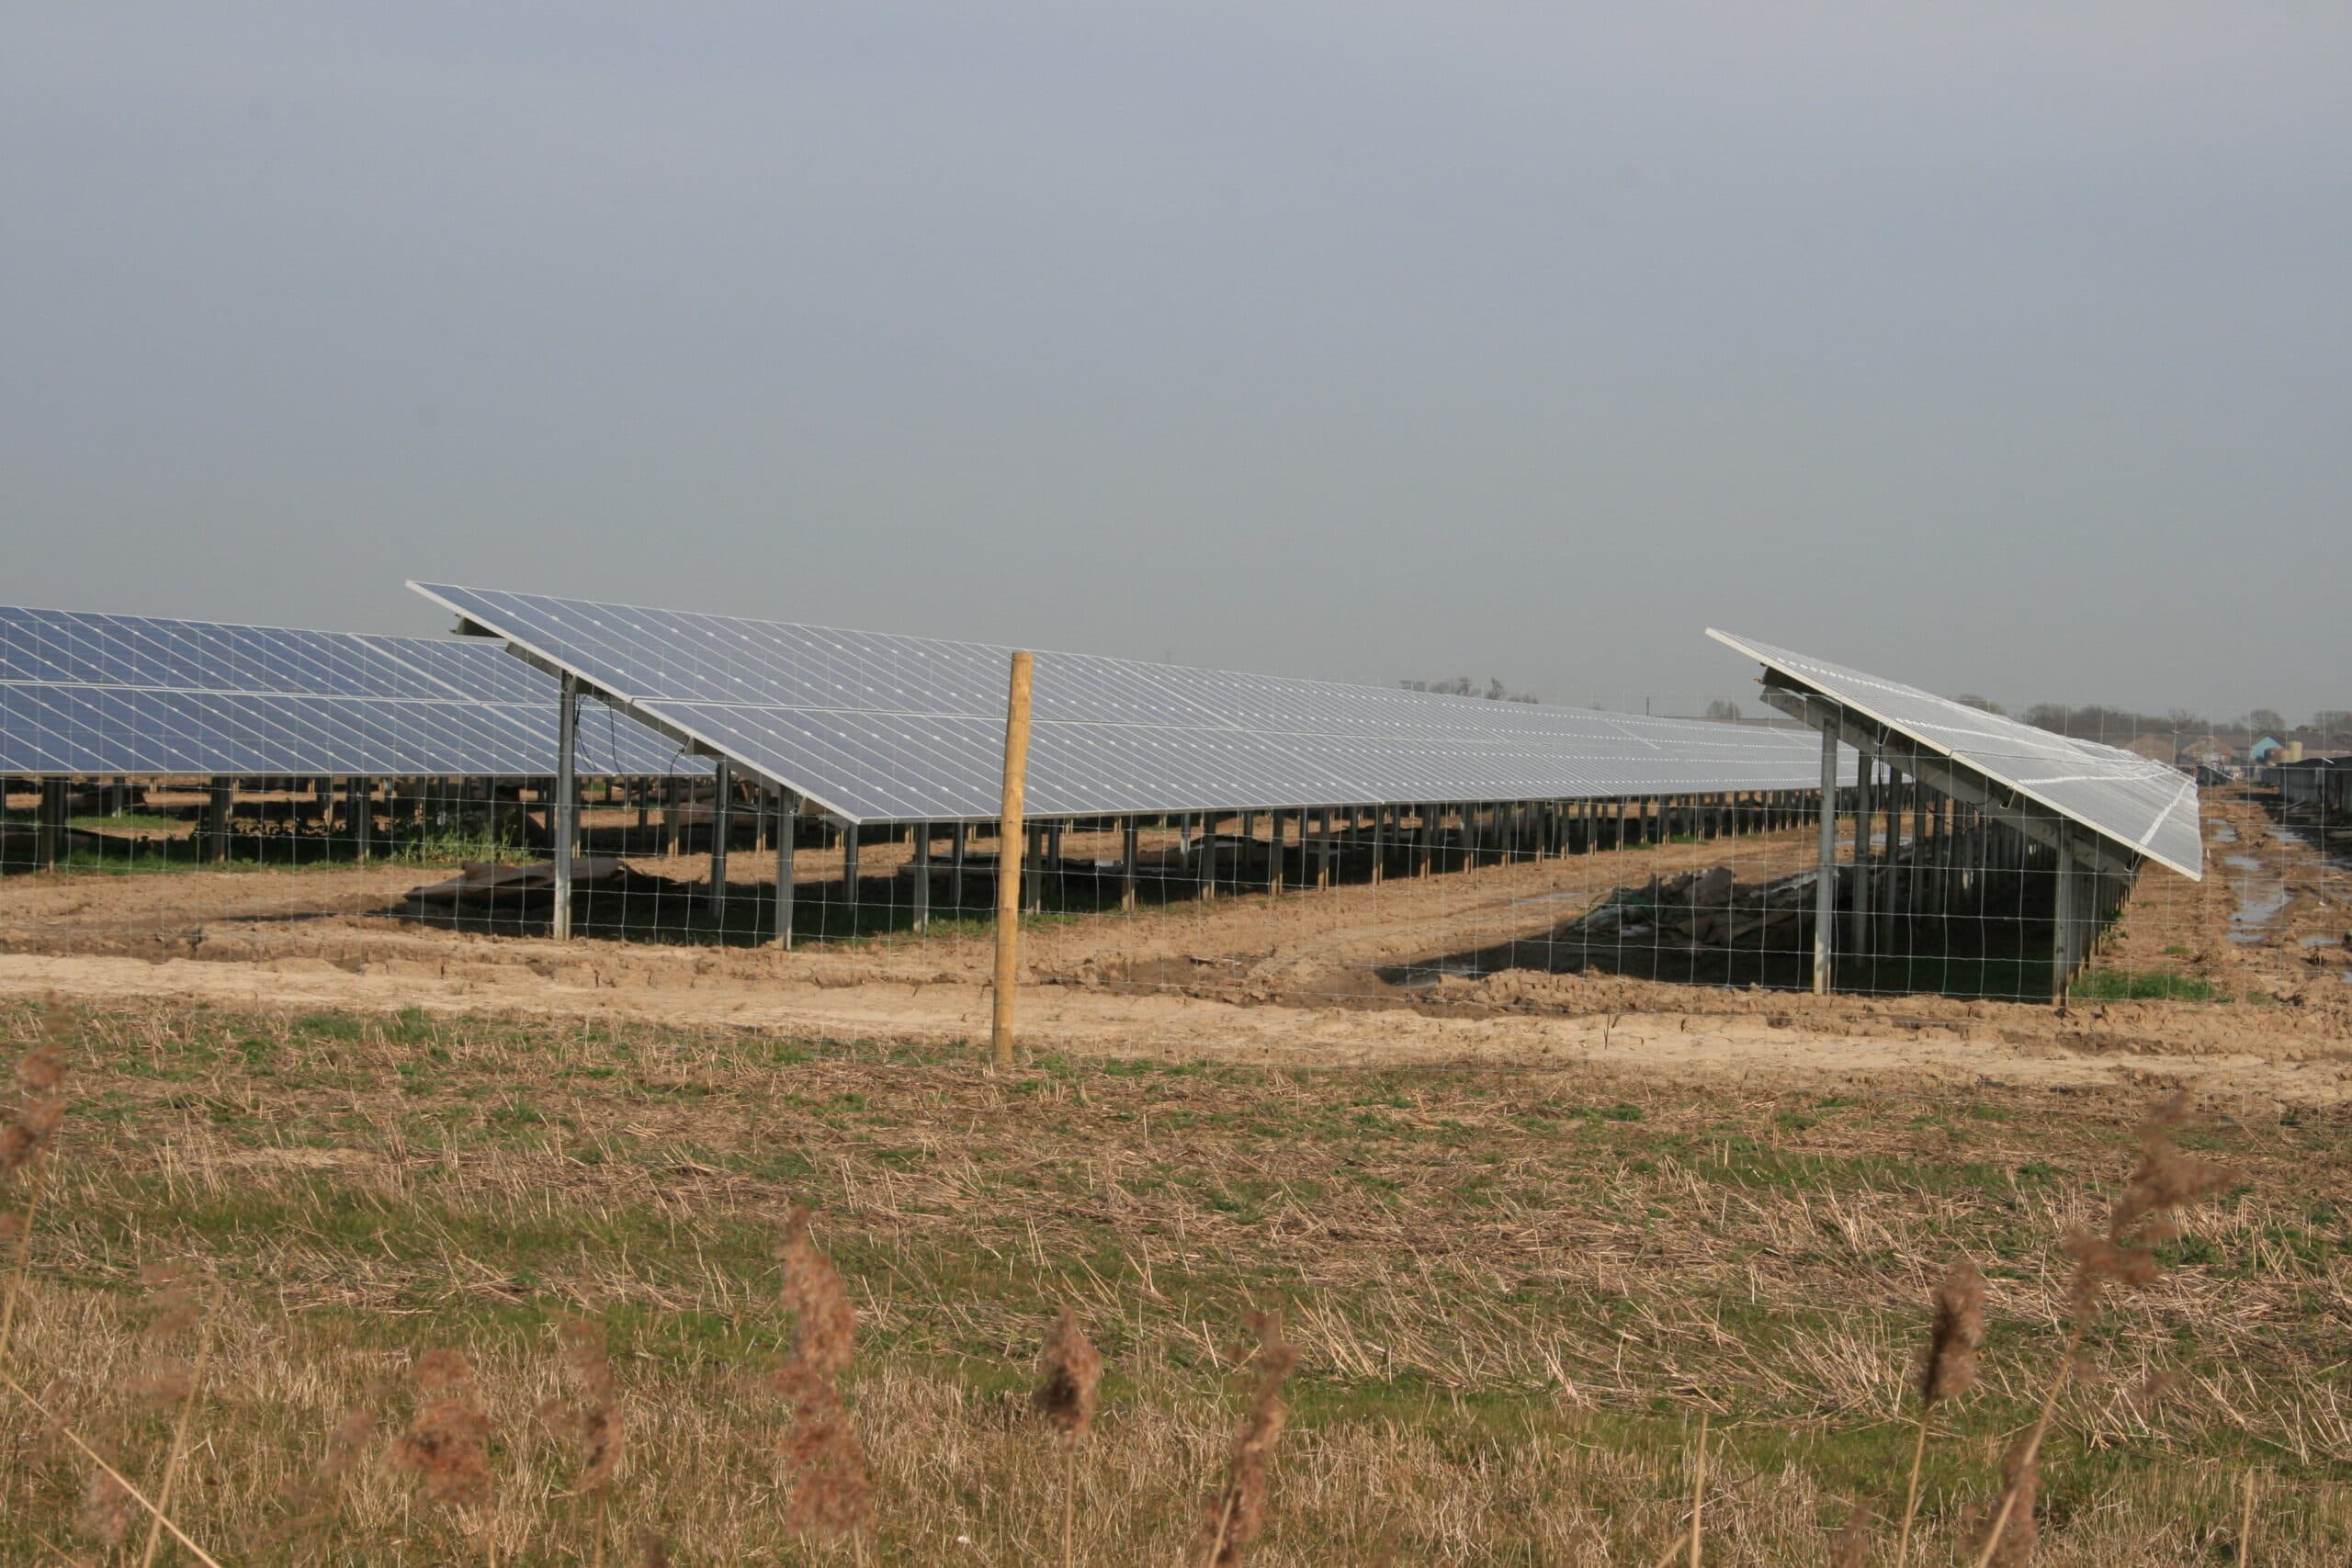
What happens when underused, contaminated land becomes a beacon of clean energy and local prosperity? That’s the question at the heart of our latest project with the National Brownfields Coalition. Across the country, thousands of brownfield sites—once industrial or polluted spaces—are being reimagined as brightfields: locations for solar and renewable energy generation. But as this transformation accelerates, it’s critical to understand not only where solar can be built, but also how these projects can unlock long-term economic benefits for surrounding communities.
Why economic potential matters
Siting solar on a brownfield can spark job creation, strengthen local tax bases, and reduce energy burdens—but not all brownfields offer the same opportunities.
A brownfield in a dense, transit-rich metro area may generate ripple effects through nearby commercial corridors, while a rural site near a substation might serve as an anchor for long-term regional planning.
In other words: it’s not just about asking “Can we build solar here?” but “What happens when we do?”
That’s why Smart Growth America and the National Brownfield Coalition are working together to build tools to develop tools that help communities and planners assess the economic potential of brownfields alongside their solar viability.
Explore our map
We’ve created a live, interactive map that combines brownfield sites from EPA’s RE-Powering data with the metrics described below. Users can explore each site’s solar profile, infrastructure readiness, and surrounding economic indicators.
It’s a work in progress, but it’s already helping communities and coalitions see the full landscape of opportunity—and begin deeper conversations about solar equity, land reuse, and inclusive economic development in the clean energy transition.
Open the interactive map in a new window.
How we measure economic potential
We started with the U.S. EPA’s RE-Powering America’s Land dataset, which identifies sites suitable for renewable energy reuse. We selected only the brownfield sites and overlaid data from a range of federal sources to capture each site’s context. Here's a sample of what we’re analyzing:
1. Site-level energy data from the RE-Powering dataset
-
Solar potential (estimated PV capacity, solar irradiance)
-
Infrastructure proximity (substations, transmission lines, roads, rails)
-
Wind, geothermal, and biomass potential
2. Block group–level economic indicators, including:
-
Employment and employment density (from the U.S. Census LODES database)
-
Unprotected land availability (from EPA Smart Location database)
-
Walkability and transit access (e.g. jobs accessible by transit or driving within 45 minutes)
-
Road network density
By combining these spatial and socioeconomic indicators, we can begin to paint a more complete picture of whether a site can support not just clean energy generation, but also people, jobs, and long-term community benefits.
Context matters
Our research underscored a critical truth: there’s no one-size-fits-all formula for economic potential.
Some metrics carry more weight in urban areas (like transit access), while others matter more in rural settings (like distance to transmission lines). A five-acre brownfield near a university might drive workforce development opportunities, while a 30-acre site in a post-industrial corridor might align with regional clean manufacturing goals.
So while we’re exploring the potential of developing a standardized rubric or score, we’re also approaching it with humility. We’ve seen how the meaning of “potential” can shift based on context—and we’re building our tools to reflect that nuance.
Developing this tool means assigning “value weights” to different measures. For example, if walkability is prioritized, the EPA National Walkability Index might carry more weight—favoring sites in areas with strong local infrastructure and amenities.
Related News


Livable places. Healthy people. Shared prosperity.


© 2026 Smart Growth America. All rights reserved
Site By3Lane Marketing
