Signature reports

The Best Complete Streets Policies 2025

Over the past two decades, communities across the U.S. have increasingly embraced the Complete Streets approach. The 2025 Best Complete Streets Policies report evaluates and ranks the 43 policies adopted in 2023 and 2024, highlighting what sets the top performers apart.

State-level Complete Streets policies

States across the U.S. own some of the deadliest roadways for pedestrians—66 percent of all pedestrian fatalities in the 101 largest metro areas occur on state-owned routes. State agencies can play a huge role in improving road design and enhancing safety. While some states have enacted Complete Streets policies to address these issues, most state level policies score very low on the Complete Streets Policy Framework. Our analysis of three new state-level policies underscores the importance of state efforts and outlines strategies for enacting stronger, more effective measures.

Overview of State Policies
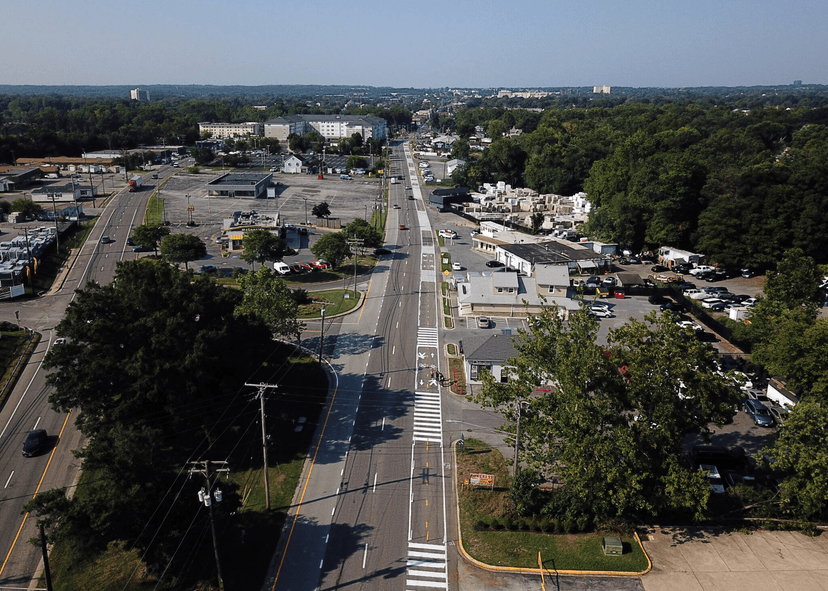
This year’s report analyzes three new state-level policies: California Senate Bill 960, Maryland Department of Transportation’s Complete Streets policy, and New Jersey Department of Transportation’s Complete Streets Policy/ Procedure. SGA has previously scored policies from eight states (California, Iowa, Maine, Minnesota, North Carolina, South Carolina, Washington, and Wisconsin), with California’s 2021 policy achieving the highest score at 61.

Overview of State Policies

*The California Department of Transportation 2021 Director’s Policy scored a 61 in the previous Best Complete Streets Policies Report. The 2024 California Senate Bill 960 codifies Complete Streets and was passed to ensure and strengthen implementation of the 2021 policy: requiring implementation targets, transparent decision-making processes, and prioritization of improvements for people walking, biking, and taking transit. Each of these policies has been scored separately on their own merit, according to SGA’s protocol. Learn more at Streetsblog California and the California Bike Coalition.

Why a Statewide Policy?
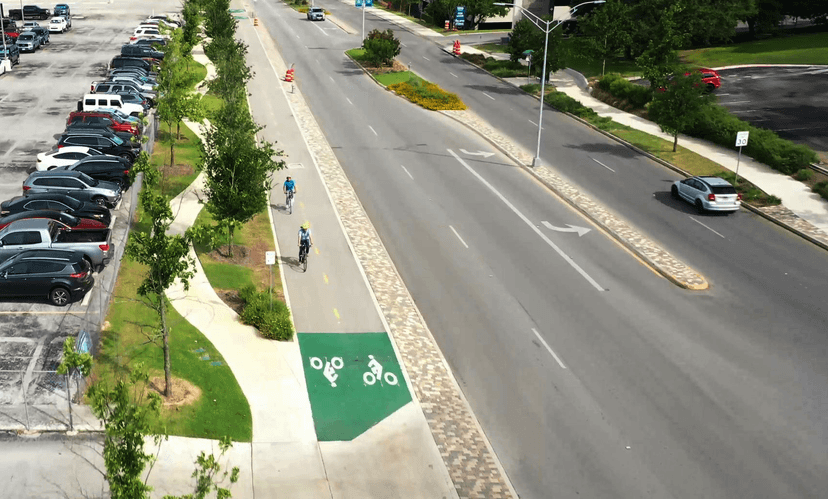
States can play a crucial role in transportation and road safety. The most dangerous roadways are owned and controlled by states. Thus, state departments of transportation can develop and implement Complete Streets policies to ensure that roads are designed and maintained to achieve safety and access for everyone. Beyond the roads that they directly control, though, state departments of transportation have significant influence on policies and jurisdictions (such as cities, towns, and counties) through funding, planning, and rule making. They can also encourage and incentivize local jurisdictions to create their own Complete Streets policies to match local conditions and needs.

Why a Statewide Policy?

Strengths and Weaknesses

The three state policies reviewed for this report clearly outline their vision (Element 1) for Complete Streets. They also clearly describe relevant design guidance (Element 6), establishing standards that enable the effective design and construction of Complete Streets and serve as models for local jurisdictions statewide.

However, the three states reviewed for this report do not set criteria for choosing projects (Element 9) by not updating project selection processes to prioritize Complete Streets projects. Similarly, the three policies do not adequately incorporate performance measures (Element 8) meaning that assessing true impacts will be challenging. Despite a clear Complete Streets vision, further commitment is needed to implement the Complete Streets approach fully.

Strengths and Weaknesses

Considerations

Considering the reach and broad impacts that state-level Complete Streets policies can have, states, territories, or similar jurisdictions may consider creating one. It is important that a new policy addresses all elements of the Complete Streets framework. States that currently have a lower scoring policy can work to strengthen their policies to ensure they achieve maximum benefits.

State policy spotlight: New Jersey and Washington

While this year’s report revealed five new Complete Streets policies that scored 80 points or higher, there were low-scoring policies as well. Many of the lower-scoring policies came from New Jersey and Washington. Almost 40% of the policies reviewed came from these states (17/43), with multiple localities adopting nearly identical language and formatting. Policy scores averaged around 50 points for New Jersey and around 25 for Washington. These patterns may be driven by statewide incentives, guidance, and model policy language aimed at encouraging policy adoption. The result was a proliferation of low-scoring policies that do not adequately address many of our policy framework elements.

Read the case study
logo
1350 I St NW Suite 425 Washington, DC 20005
[email protected]

Subscribe to our newsletter

Livable places. Healthy people. Shared prosperity.

© 2025 Smart Growth America. All rights reserved

Accessibility