Our Methodology Process
Step 1:
Defining Regions and Geographies
For this report, we completed our analysis on the nation’s largest 35 metropolitan regions. Given that the analysis in the report was completed on the Metro Statistical Area (MSA) and Census Block Group (CBG) levels, the first step was to identify how regionally significant an individual CBG was. In this case, MSAs are equivalent to wide regions with a mix of development, walkability levels, and economic activity; CBGs are equivalent to neighborhoods.
Step 2:
Defining Regional Significance
Regional significance was determined by using three alternative tests: 1) seeing if the block group contained a major point of interest such as a military installation, airport, or an institute of higher education with more than 1,000 students; 2) identifying if the block group was in the top 2.5% of the region’s job density or share of GDP or; 3) if the block group had at least 1.2 million square feet of office space or 340,000 square feet of retail space. These three tests are indicative of the block groups’ significance in the region’s wider economy.
Step 3:
Defining Walkability
The next step was to use existing data to define what block groups in the 35 metros were walkable. This was measured by determining if the block group was in the top 15% of its region based on the National Walkability Index (NWI); if the block group was in the top 15% of its region by Walkable-Oriented Development (WOD) and had intersection density above the national median; or if the block group was in the top 15% of its region by WOD and had a NWI that the EPA considers walkable.
Step 4:
Vetting Definitions
Next, SGA compiled a team of local experts to “ground truth” the neighborhoods that were identified as walkable, comparing data-based measurements with personal knowledge and experience.
Step 5:
Ranking the Metros
Finally, the largest 35 MSAs in the country were ranked by weighing each region’s share of walkable block groups. It is important to note that the walkable neighborhood category included neighborhoods with a significant share of Type I and Type II areas. In short, our 35 metros were ranked by the percentage of their real estate inventory (by square footage) that is located in walkable urbanism.
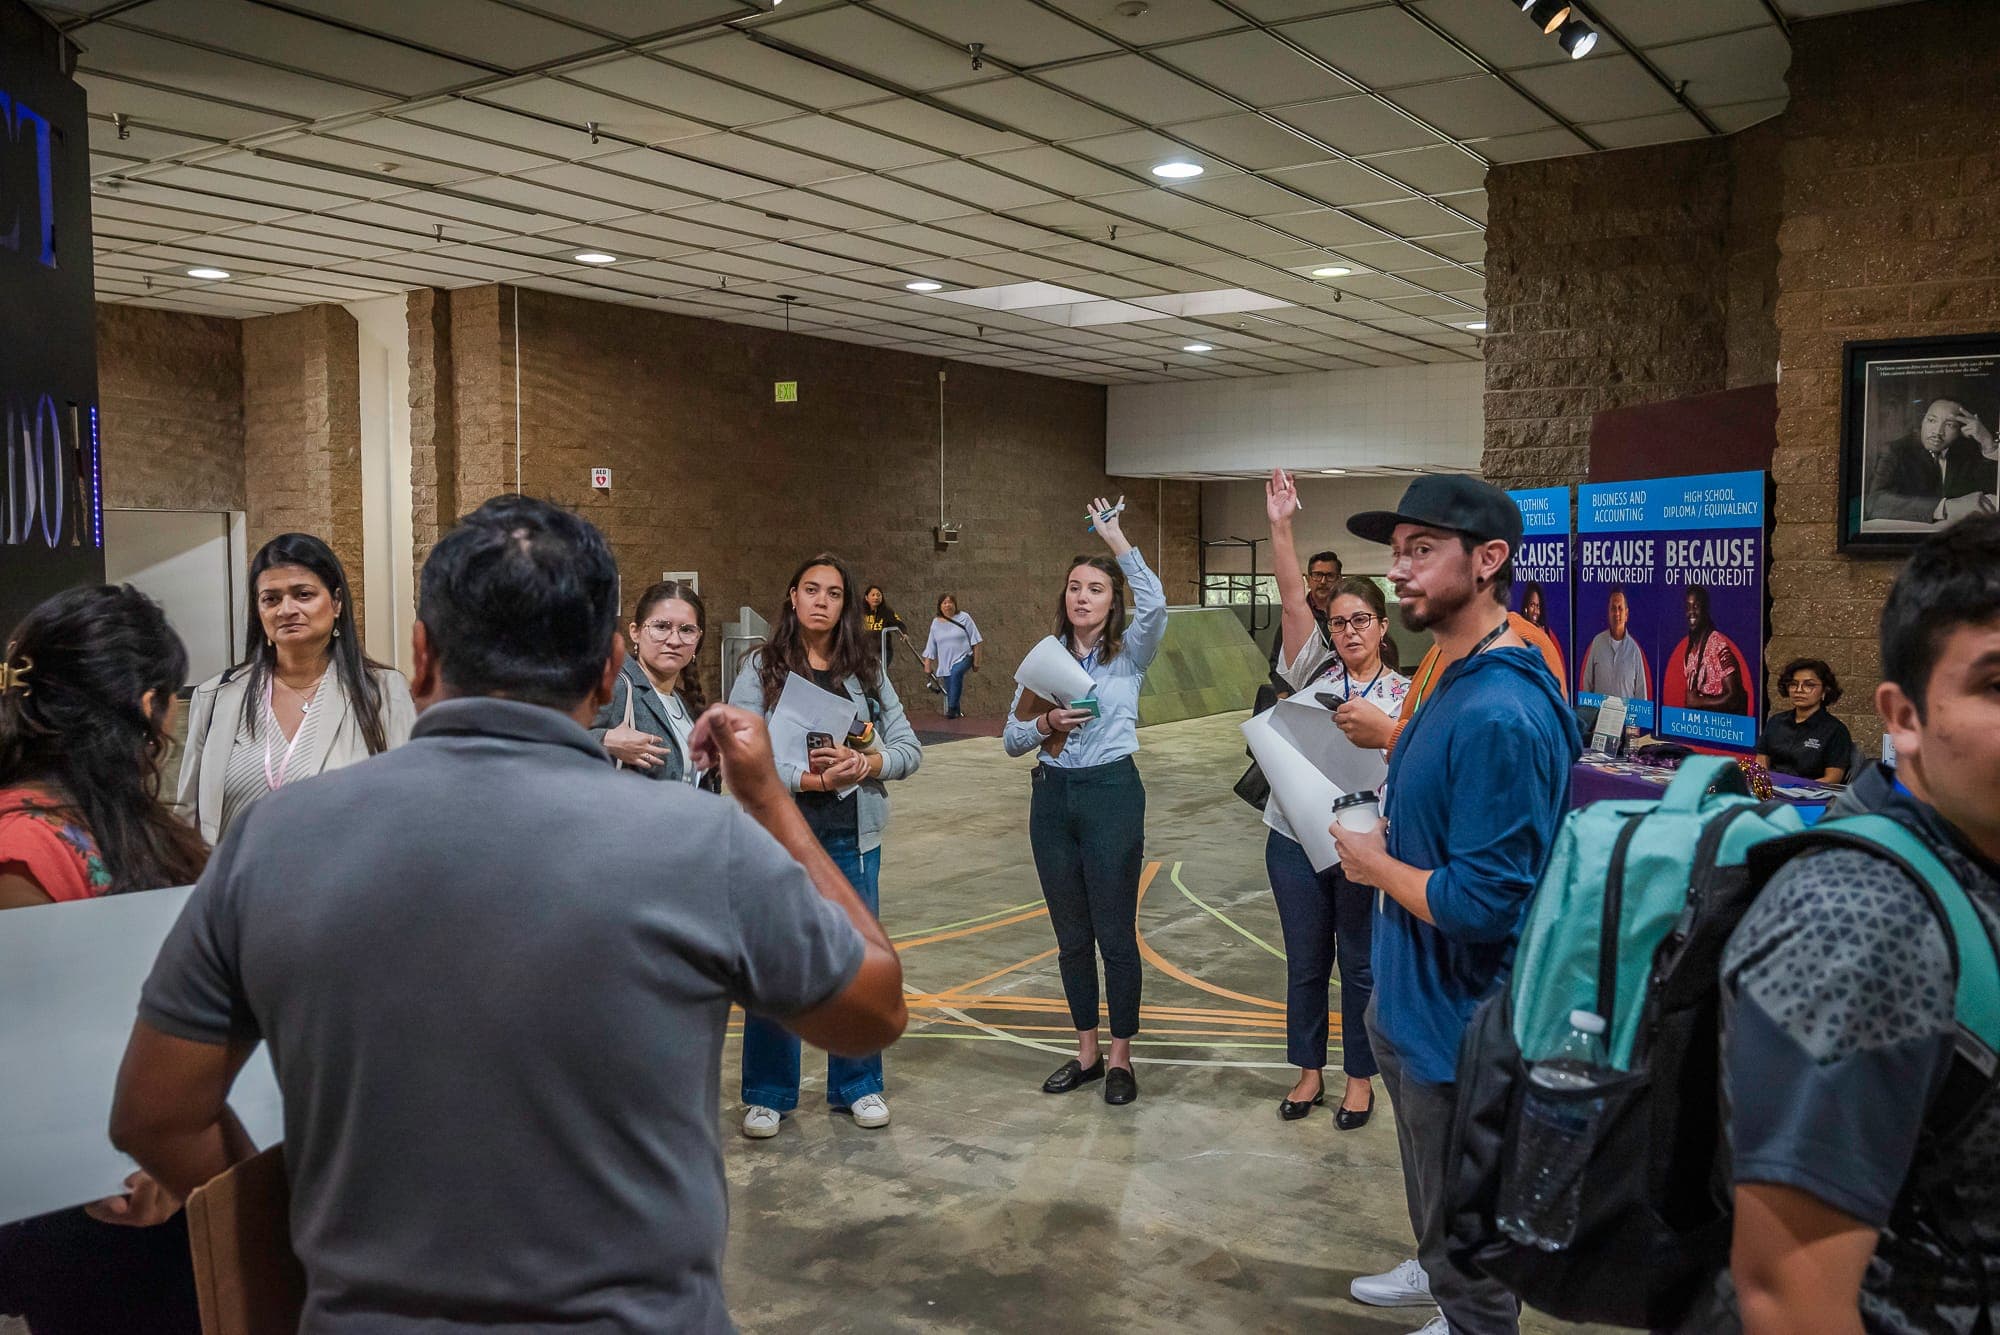
Photo by Liz Ligon / Union Square Partnership

© 2026 Smart Growth America. All rights reserved
Site By3Lane Marketing


