


Signature reports
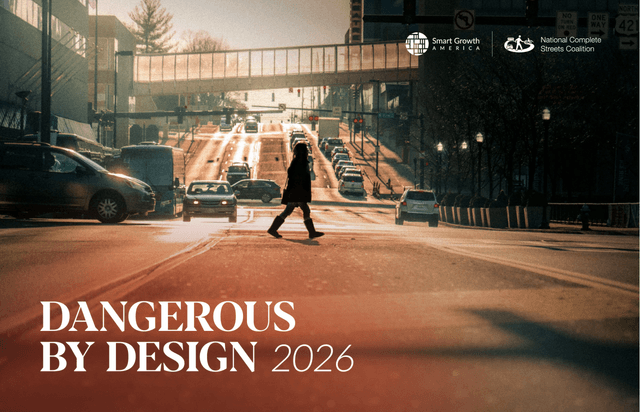
Dangerous by Design
After decades of preventable deaths, insufficient policy change, and broken promises, our streets are still dangerous by design.
Dangerous by Design 2026 ranks all 50 states and the largest 101 metro areas by pedestrian fatality rates. Every one of them is too dangerous for people walking.
Help hold dangerous roadway design accountable. Support the Dangerous by Design Accountability Initiative. Donate today.
Dangerous by Design 2026
In April 2026, Jonathan Morrison, administrator of the National Highway Traffic Safety Administration, boldly declared that “American roads are safer” as he announced a staggering total of 39,254 people killed in 2024, including 7,080 people struck and killed while walking.
The 72 percent increase in pedestrian fatalities in the 15 years from 2009 to 2024 outpaces both the growth in population and vehicle miles traveled. While pedestrian deaths have in fact decreased slightly for two straight years (2022 to 2024), 2024’s total is higher than every year on record since 1982, other than the modern-day historic highs experienced from 2021 to 2023.

Slightly less deadly is not the same thing as safe.
The families and friends of those 39,254 people killed certainly would not agree. This definition of “progress” treats tens of thousands of fatalities as an acceptable baseline. And despite recent, small year-to-year decreases, the deaths of people walking have been on a decades-long climb. We should not be celebrating a modest 3.9 percent decrease from 2023-24, considering that we are still nowhere close to 2019 levels when 6,200 total deaths of people walking led to headlines bemoaning this historic high.
Even if pedestrian fatalities keep declining at the current rate, we wouldn’t reach 2009 levels until 2042. And in the meantime, 96,615 more people would be killed while walking on U.S. roads. This is the equivalent of wiping the population of Asheville, NC, off the map because the country failed to commit to globally accepted best practices already proven to save lives.

Key Findings
A better ranking in this report doesn’t mean that fewer people are dying
Frequent readers of Dangerous by Design may notice that some states and metro areas improved their spot in the rankings this year. That does not necessarily mean that conditions improved for pedestrians. Many of these places got more deadly, but their ranking improved only because other states or metros had bigger increases in their fatality rates.
For example, Charleston, SC moved down from #9 to #12. Tucson, AZ “improved” from #3 to #4. Neither is saving lives—on the contrary, 18 more people died on Tucson’s roads (2015-19 vs 2020-24) while Charleston saw an increase of 5 deaths. These places did not get safer; other metro areas simply got worse faster.
The most dangerous places are getting far more dangerous.
For a sobering look at how the rankings compare overall, note that the first time we ranked metro areas in the 2009 version of Dangerous by Design, no metro area had a pedestrian fatality rate higher than 3.52. This year’s top 14 most dangerous metro areas have a higher rate than that and the top fatality rate of 5.5 in Memphis, TN is far more deadly than that now.

Delaware makes significant progress, but stays in the 20 most deadly states
Demonstrating the huge challenge that states have created for themselves, Delaware reduced their pedestrian fatality rate more than any other state, yet is still the 10th most deadly. Of the 20 most deadly states, 19 showed no signs of improvement or became even more dangerous. Only five states that improved in the 2024 report have continued to improve and build upon that progress in this report, and only eight states in total have improved since the last report when comparing five-year periods.

People of color and low-income communities continue to be killed at disproportionate rates
The disparities in pedestrian fatalities are not random. They are the predictable result of decades of transportation investment and design decisions that prioritize moving cars fast through communities that struggle to keep up. As the United States focused on the convenience of drivers and where they need and want to go, it did so at the cost of leaving lower-income communities and communities of color exposed to more dangerous roads.
American Indian and Alaska Native populations continue to experience the highest pedestrian fatality rates in the country, at 3.7 times the national average. Black Americans are killed while walking at 1.7 times the national average. Despite making up just 16 percent of the U.S. population, these two groups accounted for 22 percent of pedestrian deaths between 2020 and 2024. These disparities reflect decades of transportation decisions that concentrated dangerous roadway conditions in historically underserved communities and whose voices are still not represented in decision-making processes.

Saving lives should not be controversial
The U.S. did not become a dangerous outlier by accident or due to unavoidable cultural differences. It happened because the United States failed to put real resources and intention behind implementing what is known to save lives.
We need action. That means design standards that reflect best practices, funding, and resources to actually get projects using those standards into the ground, and measures to hold those who don’t comply accountable. Real progress will only come when proven countermeasures in street design are implemented across all levels of government and jurisdictions, with consequences for those who continue to ignore them and incentives for those who lead.
The country cannot afford to stay complacent while thousands of people will continue to die tomorrow on roads we know how to make safer today

Livable places. Healthy people. Shared prosperity.


© 2026 Smart Growth America. All rights reserved
Site By3Lane Marketing
